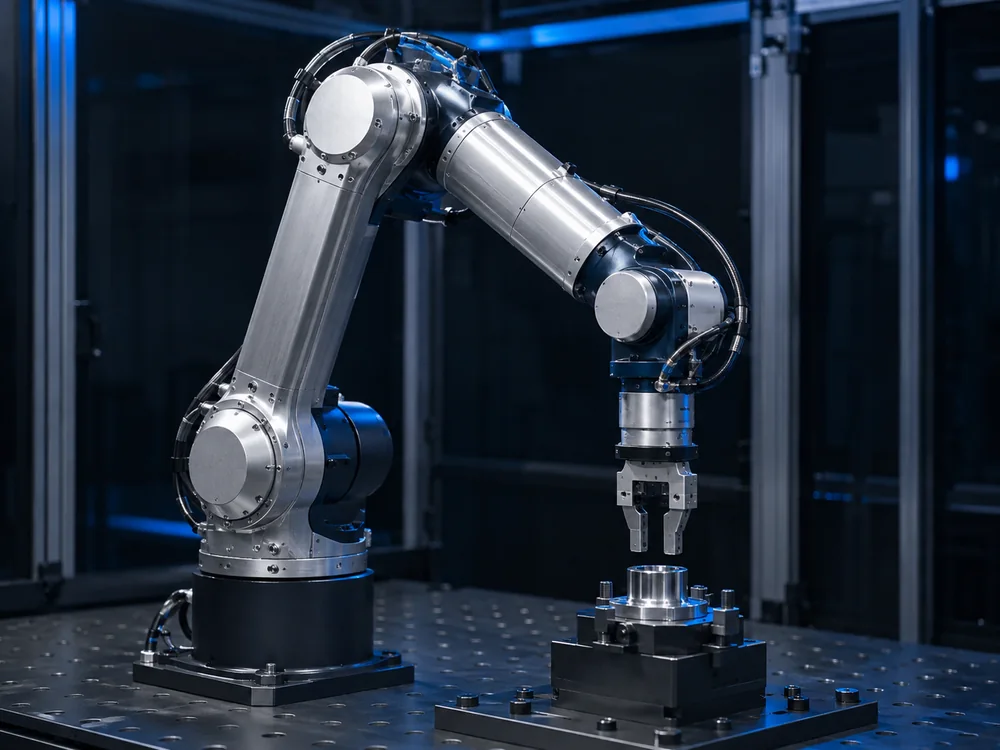
POWER CONVERSION / MOTOR CONTROLGaN HEMT / MOTOR DRIVE
POWER INMOTION.
GaN inverter design. For efficient motor drives.
We develop GaN HEMT inverters for PMSM and BLDC motors. Our design
work addresses power loss, cooling and current control to improve
efficiency and output capability.
The following sections explain design principles and review criteria.
They do not report product test results or confirmed specifications.
01POWER ELECTRONICSPower electronics
Fast transitions can reduce switching loss, but high current slew
rates can also produce voltage overshoot across parasitic
inductance. Device selection and PCB layout need to be considered
together.
Gate voltage and drive impedance must suit the selected device.
Power loops, gate loops and return paths influence ringing,
unintended switching and electromagnetic emissions.
DESIGN REVIEW POINTS
Loops & layout
Power and gate loop parasitics; decoupling placement
Transition quality
Voltage and current waveforms; overshoot, ringing and drive
conditions
Conduction and switching losses are major sources of heat in the
power stage. Loss estimates depend on current, switching frequency
and device temperature; thermal design must also account for the
path from the device to the cooling system.
Continuous operation and short peak loads produce different
thermal responses. Estimating peak junction temperature requires
load duration, repetition and transient thermal response as well
as average loss and steady-state thermal resistance.
DESIGN REVIEW POINTS
Steady state
Ambient and cooling conditions; junction temperature under
continuous load
Transient response
Peak-load duration, repetition and transient thermal
impedance
Conduction and switching loss
Simplified estimates for understanding a single device.
Channel conduction loss
P_cond approximately equals I_rms squared times R_DS
onPcond ≈ Irms2 RDS(on)
At constant on-resistance, conduction loss is proportional to
RMS current squared. Iᵣₘₛ is the on-state channel current of
one device evaluated over the full period, with off intervals
set to zero. It differs from motor phase RMS or RMS over only
the on interval; do not apply duty again. In practice, RDS(on)
varies with temperature and other operating conditions.
Switching transition loss
P_sw approximately equals f_sw times the sum of E_on and
E_offPsw ≈ fsw (Eon +
Eoff)
For fixed Eon and Eoff, switching loss increases with
switching frequency. The equation assumes one turn-on and
turn-off pair per period. Both energies depend on operating
voltage, current and gate-drive conditions.
Total inverter loss requires a separate calculation. Check the
scope of measured loss terms to avoid omissions or double
counting.
Motor control and overcurrent protection require current
measurements at appropriate sampling instants. Switching noise,
signal settling, sensing topology, PWM timing and ADC latency
determine the usable measurement window.
Dead time is used to avoid simultaneous conduction of the upper
and lower switches in the same leg, but also affects
reverse-conduction loss. Gate-drive delays and switching timing
must be reviewed together. Fault detection and shutdown response
require a separate timing assessment.
DESIGN REVIEW POINTS
Sensing & control
Sensing location, settling, sampling timing and motor
feedback
Protection & timing
Gate-drive delay, dead time and the fault-to-shutdown path
The inverter switches a DC supply to produce motor terminal voltages.
Current measurements and motor feedback inform control and protection
design.
INPUTDC source
→
CONVERSIONGaN HEMTInverter
→
MOTIONPMSM / BLDCMotor
Conceptual energy flow. Not a product configuration or specification.
WHY GaN / BEYOND THE DEVICE
GaN characteristics. Design implications.
Gate charge, reverse conduction and switching frequency affect
power-stage losses and operation. Evaluate each under the intended
circuit and operating conditions.
01GATE CHARGE
Gate charge and speed.
Low gate charge can support fast transitions and lower gate-drive
loss.
Actual transition speed depends on the device, driver and circuit
parasitics.
E-mode GaN has no p–n body-diode reverse-recovery charge.
Reverse conduction and output-capacitance charging currents still
occur. Review dead-time voltage drop and duration separately from
capacitance-related switching loss.
Fast switching provides greater flexibility in selecting the
switching frequency.
Review transition and drive losses, current ripple and emissions
together. Output-capacitance charging and its associated losses also
depend on the circuit and switching conditions.
Compare semiconductor conduction and switching losses with magnetic core and winding losses, then examine how heat flows to the cooling system.
LOSS ATLAS / DEVICE TO SYSTEM
Inverter loss analysis
Compare models for conduction, switching and magnetic-component losses, including the boundaries and conditions needed to calculate total inverter loss.
System boundary for total loss
The boundary here is the inverter. Magnetic losses apply only to inductors or transformers actually inside that boundary. Motor iron and copper losses are separate. Align time intervals and measurement boundaries to avoid double counting.
j: semiconductor device · m: magnetic component · cond: on-state conduction · sw: transitions · rev: separate reverse conduction · core/cu: core/winding · aux: remaining drive/control/supply losses not counted above · other: capacitors, interconnects and remaining losses
CONDUCTION / SENSITIVITY
Current waveform and effective on-resistance
GaN conduction loss depends on the current waveform, conduction intervals, junction temperature, gate-drive conditions and preceding voltage stress. These conditions must also be considered when applying an I²R model.
Current sensitivity of conduction loss
Loss relative to referenceP / Pref
On-state device RMS current ratioI / Iref
Positive reference values · dimensionless axes · not product measurements. Control and plot ranges are chosen for comparison; they are not physical limits or allowable operating ranges of a device or material.
Detailed models · equations and boundaries
Pcond = (1/Tobs)∫0Tobs g(t) Reff(t) i2(t) dt
Reff(t) = RDS(on)(Tj(t), VGS(t), i(t), h(t))
In the resistive on-state, treat RDS(on) as an effective resistance dependent on Tj, VGS, device current i and stress/recovery history h. The mask g(t) is 1 during on-state channel-conduction intervals and 0 otherwise. Exclude transition intervals and off-state reverse conduction.
Dynamic on-resistance in GaN can differ from the DC value. Characterization must match off-state voltage, stress duration, switching conditions and observation time. The graph intentionally omits these dependencies to isolate the I²R relationship.
Tobs [s]: averaging interval · i [A]: device current · RDS(on) [Ω] · Tj: junction temperature · VGS [V] · g: dimensionless. At fixed resistance, I²rms,on = (1/Tobs)∫g(t)i²(t)dt: full-interval RMS with off intervals set to zero. Conduction duty is already included; do not multiply by duty again or directly substitute motor phase-current RMS.
SWITCHING / SENSITIVITY
Switching energy and switching frequency
Switching frequency alone does not determine switching loss. Evaluate the voltage, current, temperature, drive conditions and parasitics at each device transition.
Switching-loss sensitivity to frequency
Loss relative to referenceP / Pref
Switching-frequency ratiofsw / fref
Positive reference values · dimensionless axes · not product measurements. Control and plot ranges are chosen for comparison; they are not physical limits or allowable operating ranges of a device or material.
Detailed models · equations and boundaries
Psw,Σ = (1/Tobs)Σj (Σk∈on Ej,k+ Σk∈off Ej,k)
Sum across all devices j and transition events k within the observation interval. Eon,k and Eoff,k are loss energies at their respective operating points. Relate the terminal integral ∫vDS iD dt to heat only after accounting for stored/recovered energy and measurement boundaries.
E = E(VDS, ID, Tj, VGS, Rg, parasitics, commutation mode). Align voltage/current probe timing and integration windows, and use the actual hard- or soft-switching conditions.
Prev,Σ = (1/Tobs)Σj ∫Ωrev,j |vSD,j|· |ij| dt
Evaluate reverse conduction during dead time from its voltage drop, current and duration. An e-mode GaN HEMT has no intrinsic p–n body-diode reverse recovery; this does not imply zero reverse-conduction or output-capacitance-related loss. Assess cascodes and external diodes separately. Do not add a term already included in Eon/Eoff.
Tobs [s] · E [J] · P [W] · fsw [Hz]. For one device, one turn-on and one turn-off per cycle at fixed conditions give Psw ≈ fsw(Eon + Eoff). Ωrev,j contains gate-off reverse-conduction intervals of device j, excluding on-state g(t) intervals and transition-energy windows.
MAGNETIC / SENSITIVITY
Core loss and winding loss
The total loss of a magnetic component is the sum of core loss and winding loss. Core loss depends on the flux-density waveform B(t); winding loss depends on DC and harmonic currents and resistance at each frequency.
Frequency and flux sensitivity of core loss
Core-loss density relative to referencep / pref
Flux repetition-frequency ratiof / fref
Positive reference values · dimensionless axes · not product measurements. Control and plot ranges are chosen for comparison; they are not physical limits or allowable operating ranges of a device or material.
Detailed models · equations and boundaries
The sinusoidal Steinmetz coefficients k, α and β depend on material, temperature and the fitted frequency/flux range. Here Bpk is the peak of a sinusoid without DC bias, so ΔB = 2Bpk. For PWM flux, use the actual B(t) slopes and excursions; substituting switching frequency alone is insufficient.
pcore = (1/TB)∫0TB ki |dB/dt|α· (ΔB)β−α dt
Pcore ≈ Vcore pcore
This iGSE describes a single closed flux loop per period. ΔB is that loop’s peak-to-peak flux density and TB is its period. ki is converted using the chosen Steinmetz convention; it is not k. Separate major and minor loops, sum all loop loss energies, and divide by the complete observation period.
ki = k / [2β−α· (2π)α−1· ∫02π |cos θ|α dθ]
DC bias, temperature, relaxation during zero-voltage intervals and local flux concentration are not generally resolved by the basic iGSE. Use measurements within the material/waveform range and extended models where needed. Do not add separately decomposed hysteresis/eddy-current losses on top of the total core loss fitted by iGSE.
Pcu = IDC2 RDC(T)+ Σn≥1 In,rms2· Rac(n f0, T)
δskin = 1 / √(π f μ σ)
For linear periodic steady state, use each harmonic RMS current and AC resistance. Rac is the total resistance for a specified winding/return-field condition, including DC resistance, skin and proximity effects. Significant multiwinding phase relationships or gap fringing require the corresponding field or resistance-matrix model. Do not add Rdc·Irms,total² again.
pcore [W/m³] · Vcore [m³] · Pcore [W] · B, ΔB [T] · TB [s] · α, β: dimensionless · k, ki [W·m−3·sα·T−β]. Numerical coefficients must match the f [Hz], B [T] and pcore [W/m³] unit convention. In,rms [A], Rac [Ω], f and f0 [Hz]. f0 is the winding-current fundamental frequency; n is a positive integer. T in the winding equation is temperature on the resistance data’s scale. Skin depth δskin [m] uses a classical homogeneous-conductor approximation, with μ [H/m] and σ [S/m]. Vcore·pcore assumes approximately uniform loss density.
Each graph uses a different loss reference. The normalized curves cannot be added to calculate total loss or efficiency. Actual prediction requires device, magnetic-material, winding and operating-point data.
02 / THERMAL PATHΔT
Junction temperature and cooling.
The package, PCB and cooling structure determine how heat leaves the device. To estimate junction temperature, account for power loss, thermal resistance and the temperature of the ambient air or coolant.
Device junctionWhere heat is generated
01
Package / PCBHeat transfer and spreading
02
Thermal structureInterfaces and heat-flow path
03
Ambient / coolantAmbient air or cooling fluid
04
Single equivalent heat-flow path
ΔT≈Ploss × Rθ
This steady-state approximation represents heat flow from one device, dissipating Ploss [W], through one equivalent path. ΔT [K] is the junction-to-ambient or junction-to-coolant difference; Rθ [K/W] must span the same two points. Do not multiply total inverter loss by one device’s Rθ. Mutual heating, parallel paths and transient response require separate analysis.
Conceptual relationship · not product measurements
Power dissipation generates heat. Junction temperature follows from the heat-flow path and its cooling boundary. Conduction through materials, temperature drops at contacts and convection into a fluid connect the heat source to the cooling system.
01 / CONDUCTION
Conduction / heat through a material
For heat flowing through a uniform flat layer, greater thickness increases thermal resistance. Greater conductivity and cross-sectional area reduce it.
Rcond = L / (kA)Q̇ = (Thot − Tcold) / Rcond
Steady, one-dimensional conduction; constant k and A; no heat generation within the layer. L is thickness [m], k conductivity [W/(m·K)], and A area normal to heat flow [m²]. Q̇ is heat-transfer rate [W]; R is thermal resistance [K/W].
02 / CONTACT
Contact / a temperature drop at the interface
Surface roughness, flatness and clamping pressure affect thermal contact. Bulk conduction through a TIM and contact resistance at its two faces are separate terms.
Rct = 1 / (hcAct)ΔTct = Q̇Rct
hc is areal contact conductance [W/(m²·K)]; Act is the contact area to which it applies [m²]. Do not add the same contact resistance again to measured TIM resistance that already includes it.
03 / CONVECTION
Convection / heat from a surface to a fluid
The surface-to-fluid temperature difference drives heat transfer. Fluid properties, velocity, channel geometry and flow regime determine h.
Q̇conv = hAwet(Ts − Tfluid)Rconv = 1 / (hAwet)
A lumped approximation using h [W/(m²·K)] and representative surface and bulk-fluid temperatures. Wetted area Awet [m²] is distinct from TIM contact area.
04 / RADIATION
Radiation / electromagnetic energy exchange
Radiation depends on the difference of fourth powers of absolute temperature. When a surface loses heat by both convection and radiation, add their heat-transfer rates.
Q̇rad = εσArad(Ts4 − Tsur4)
An isothermal diffuse-gray surface viewing only much larger isothermal surroundings, with view factor 1 and a nonparticipating medium. Arad is radiating area [m²]; ε is emissivity; Ts and Tsur must be in K. σ ≈ 5.6704 × 10⁻⁸ W/(m²·K⁴).
05 / COOLANT ENERGY BALANCE
Coolant / flow and inlet–outlet heat balance
The net heat-transfer rate into the coolant depends on its mass flow rate, specific heat capacity and temperature rise. For the same absorbed heat rate and specific heat capacity, a higher mass flow rate gives a smaller inlet–outlet temperature difference.
Q̇coolant = ṁcp(Tout − Tin)
Steady single-phase flow with constant cp; neglect shaft work and kinetic/potential energy changes. ṁ [kg/s], cp [J/(kg·K)], and Q̇coolant [W], the net heat-transfer rate entering the coolant.
FIELD EQUATION → THERMAL CIRCUIT
From a temperature field to a transient response
Conduction, convection and radiation become internal transport and boundary conditions in the heat equation. Reducing the field to temperature nodes, resistances and capacitances gives a thermal circuit model.
Heat diffusion / a stationary solid
ρcp ∂T/∂t= ∇·(k∇T) + q‴
ρ is density [kg/m³], cp specific heat [J/(kg·K)], k isotropic thermal conductivity [W/(m·K)], and q‴ volumetric heat generation [W/m³]. With no phase change or thermomechanical coupling, the local energy-storage rate equals net conduction input plus internal generation, all per unit volume.
q″ = −k∇T [W/m²] is heat flux. Convection and radiation act as surface boundary conditions; contact interfaces have a heat-flux-dependent temperature jump. Specify the initial temperature and each boundary condition.
Lumped capacitance / one temperature node
Cθ dT/dt= P(t) − (T − Tb)/Rθ
For approximately uniform node temperature and volumetric heat capacity ρcp, Cθ = ρcpV [J/K], where V is node volume [m³]. The part of power loss P(t) [W] not yet leaving through the boundary increases internal energy. Tb is the constant reference-boundary temperature; t is time [s].
With constant Rθ and Cθ, T(0) = Tb and constant Pstep applied from t = 0, the step response below follows. τ = RθCθ [s] sets the timescale. Cθ does not change the steady-state rise.
ΔT(t) = PstepRθ(1 − e−t/τ)ΔT = T − Tb
Resolve a large temperature variation with multiple nodes. Distinguish a network representing physical heat paths from a fitted Foster network; its internal nodes do not represent literal layer interfaces.
FROM PRINCIPLES TO MODELS
Models for coordinate transforms, current control and thermal response.
02 / THE INVERTER IN DEVELOPMENT
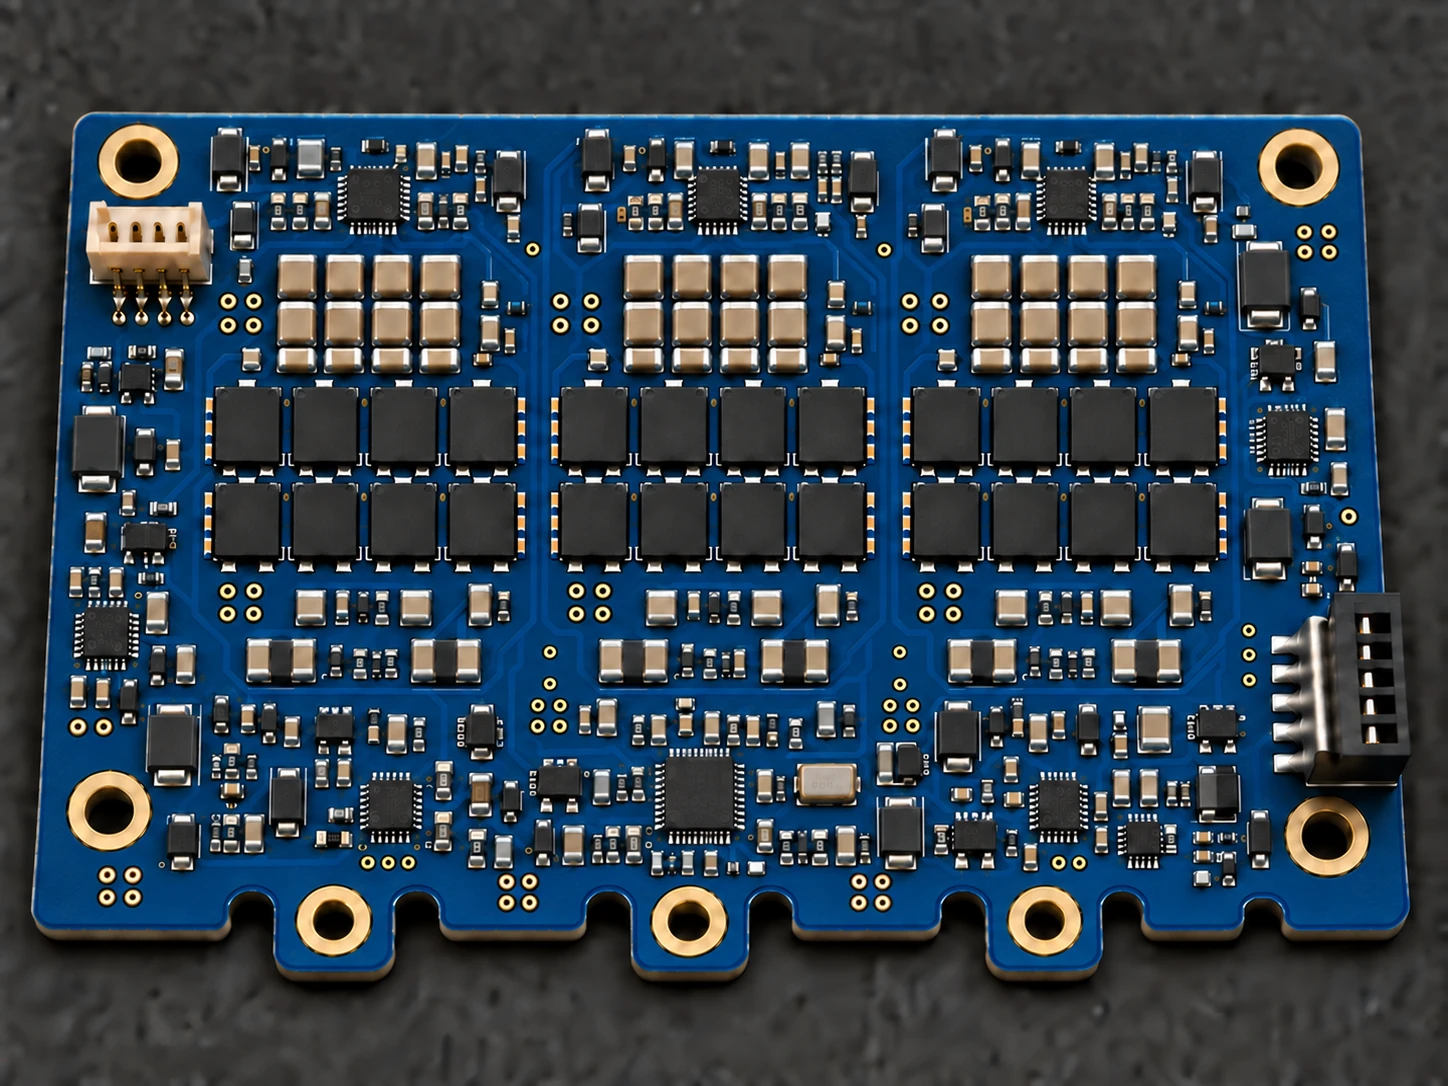
GaN HEMTPOWER STAGE / CONCEPT
Power-loop layout and flux cancellation
Closely coupled opposing current paths in the same loop partially
cancel their magnetic fields, reducing parasitic loop inductance.
Keep local DC-link connections to the switches short, while also
considering switching-node parasitic capacitance.
Cross-section of the outgoing and return current paths
Power-stage design concept. Not an actual product photograph.+
GaN HEMT. Three-phase inverter.
We review supply voltage, motor characteristics, cooling and control
requirements to define the inverter’s application scope and
development priorities.
Power technology
GaN HEMT
Motor focus
PMSM / BLDC
Application focus
Student E-Formula · AGV · Robotics
Detailed specifications have not yet been released. The stated design
targets are not test results or confirmed ratings.
ENGINEERING THE NEXT DRIVE
Designed around your drive requirements.
Supply and motor characteristics, cooling conditions and control
requirements define the design inputs.We evaluate conduction and switching losses, thermal limits and
current-sensing constraints to set efficiency, power-density and
control targets.
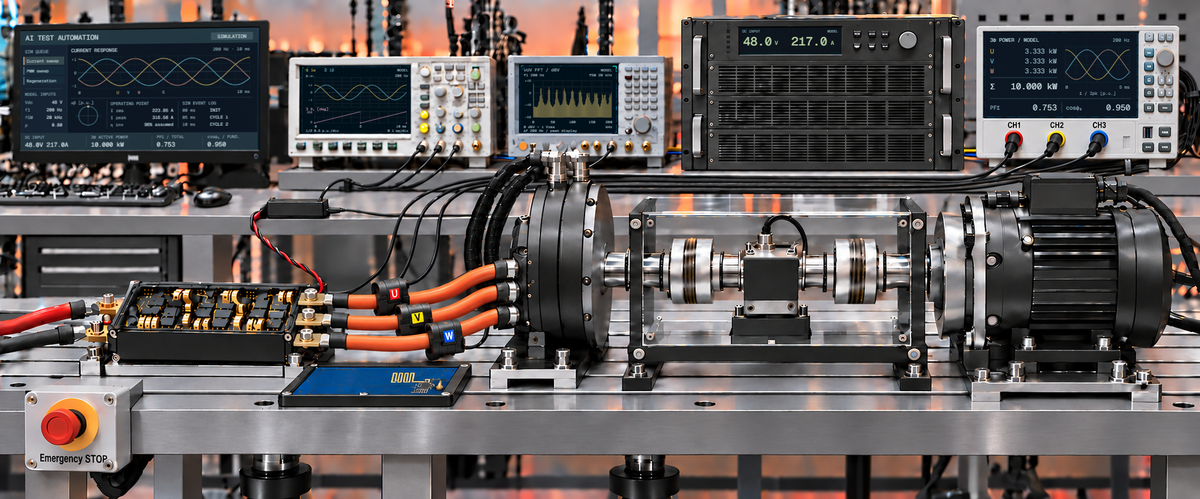
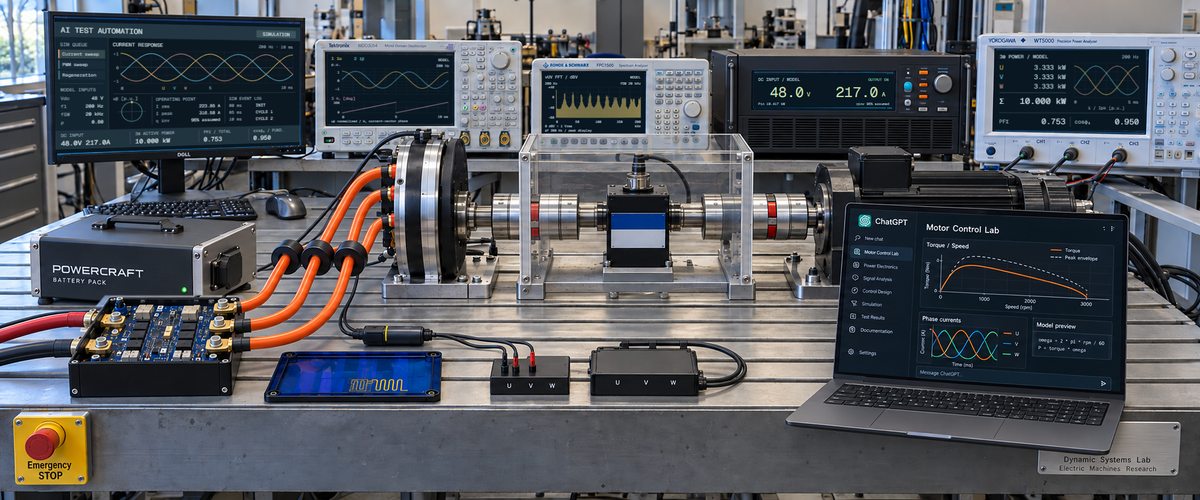
ENGINEER THE DETAILSA development setup for the inverter and motor.
01POWER CONVERSIONPower-stage loss reduction
We evaluate conduction and switching losses at the intended current
and switching conditions. Gate drive and power-loop parasitics are
reviewed to balance loss reduction against voltage overshoot.
02POWER DENSITYThermal design for continuous duty
We review heat paths through the devices, PCB and cooling structure.
Junction temperature under continuous load remains a design
constraint as the power stage becomes more compact.
03CURRENT CONTROLCurrent sensing and control response
Sensing location, PWM timing, signal settling and measurement delay
are reviewed together. The measurement and processing paths must
deliver current information in time for control and fault
protection.
04SYSTEM INTEGRATIONMotor and system integration
We define the requirements of the motor, power supply, cooling
system and supervisory controller. Their constraints inform the
inverter’s application scope and the work to be agreed for joint
development.
These are development objectives and design considerations.
Specifications, supported functions and evaluation conditions are agreed
for each product; performance must be established by testing under those
conditions.
CO-DEVELOPMENT / FROM IDEA TO DRIVE
From requirements to a validation plan
01
Define the drive targets
Define efficiency, output, installation space and operating
conditions
→
02
Review the integrated design
Review power, thermal and control needs to define the
development scope
→
03
Agree on validation criteria
Define evaluation conditions and performance metrics
Longitudinal force and yaw moment, allocated to four wheels.
Allocate force and moment requests to the wheels, then explore tire constraints and the vehicle response over time. Each stage uses its own inputs and model assumptions.
01 / BASIC ALLOCATION
Basic torque allocation
Longitudinal wheel forces sum to a total force; the left–right difference creates yaw moment. This static example calculates allocations that meet both requests under an assumed ±100 N·m torque limit at each wheel.
Force–moment allocation envelope
CALCULATED EXAMPLE
Yaw moment MzN·m
Longitudinal force FxN
Color bands: wheel-torque limit utilization≤ 25%≤ 50%≤ 75%≤ 100%
Each slider endpoint is the maximum with the other request set to zero; the two maxima cannot be achieved together. Feasibility checks only this example’s wheel-torque limits. Tire grip and actual vehicle capability require additional constraints.
Allocation within torque limitsPeak wheel-limit utilization 75%
Calculated wheel-end torque requests N·m
Wheel
Requested torque
Allocated torque
FLFront left
25.0
25.0
FRFront right
75.0
75.0
RLRear left
25.0
25.0
RRRear right
75.0
75.0
Resultant: Fx = 800 N · Mz = 240 N·m. Minimum wheel-torque headroom 25.0 N·m.
Allocation equations, assumptions and development architecture
Four conditions define this map
Effective wheel radius r
0.25 m
Full track width t
1.20 m
Assumed torque limit per wheel
±100 N·m
Front / rear steering angles
0° / 0°
Allocation that preserves force and moment
TFL = TRL =r(Fx/4 − Mz/(2t))
TFR = TRR =r(Fx/4 + Mz/(2t))
|Fx|/(1600 N)+ |Mz|/(960 N·m) ≤ 1
For equal front/rear track widths and wheel radii, each side’s torque is split equally between its front and rear wheels. This minimizes the sum of squared torques among allocations satisfying both requests; it does not imply minimum electrical loss.
Axes are x forward, y left and z up; positive Mz is counterclockwise viewed from above. Wheel-end torque is positive when it produces forward force. Whether negative torque brakes or drives in reverse depends on wheel rotation. This static model neglects wheel angular acceleration and rolling resistance, so Fx,i = Ti/r. Tire friction, lateral forces, load transfer and speed-dependent motor and battery constraints belong in the vehicle model.
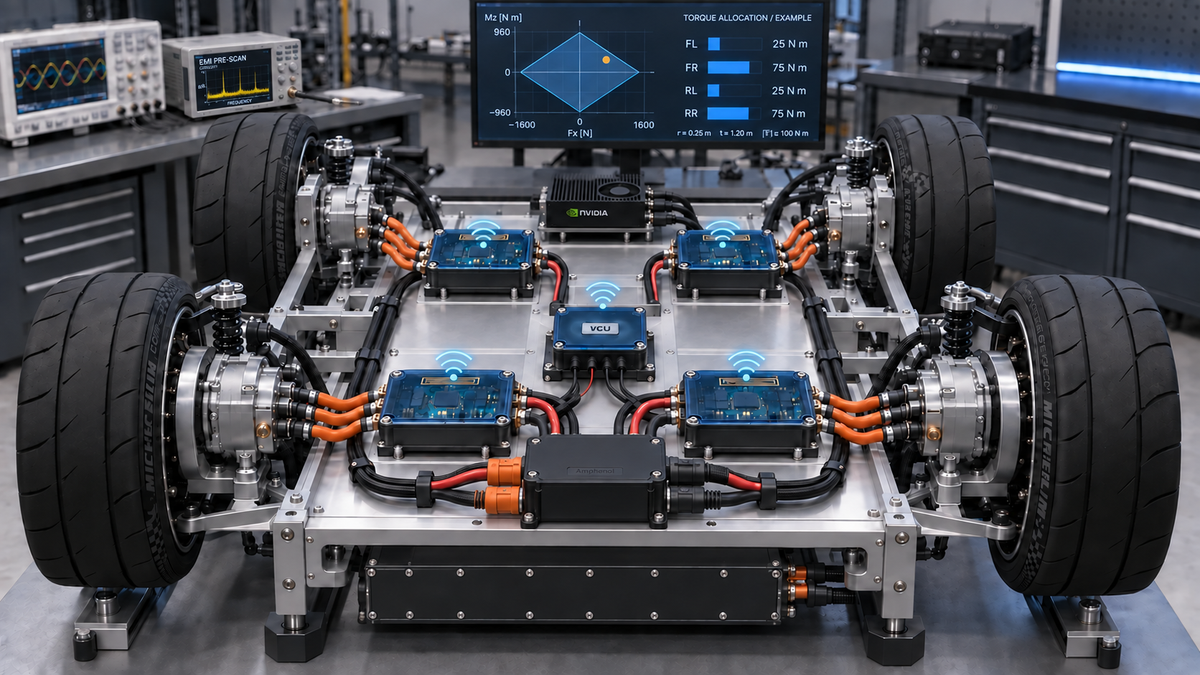
Development architecture for distributed drive
The concept would coordinate four GaN inverters through a VCU, with each inverter running its current loop locally. It would use an NVIDIA GPU for vehicle-model computation and allocation research, with torque commands and operating status exchanged wirelessly. Torque-command timing and communication-fault behavior are separate design tasks.
03 / VEHICLE RESPONSE
Vehicle yaw response
Compare target and actual yaw rates and the vehicle path under a fixed steering input. Change speed, steering and requested drive force, then explore how wheel friction, torque limits and drive faults affect the time response.
Preparing the vehicle yaw response.
03 / BEYOND THE TRACKAPPLICATION-DRIVEN ENGINEERING.
ENGINEERED FOR MOTION.
We review inverter requirements for Formula-style electric racing
(Student E-Formula), automated logistics and robotics, based on the
motor and operating conditions of each application.
01E-MOTORSPORT
Student E-Formula
Drive systems for student electric race cars.
Discuss inverter requirements and technical collaboration for
student electric racing projects, based on the power supply, motor
and operating conditions.
PowerCraftMotion is PowerCraft’s GaN HEMT inverter development
project. We define application requirements for the supply, motor and
operating conditions, then identify the technical collaboration and
joint development work required.
Project foundation
PowerCraft’s GaN inverter development project
Development focus
GaN power conversion and control for motor drives
ENGINEERING COLLABORATIONFROM REQUIREMENTS TO DESIGN.